Introduction to the Atlas Platform
The Atlas Platform is a tool to help people work with the Reinventing Organizations Map.
You can learn more about working with the Reinventing Organizations Map and the Atlas Platform in the following articles
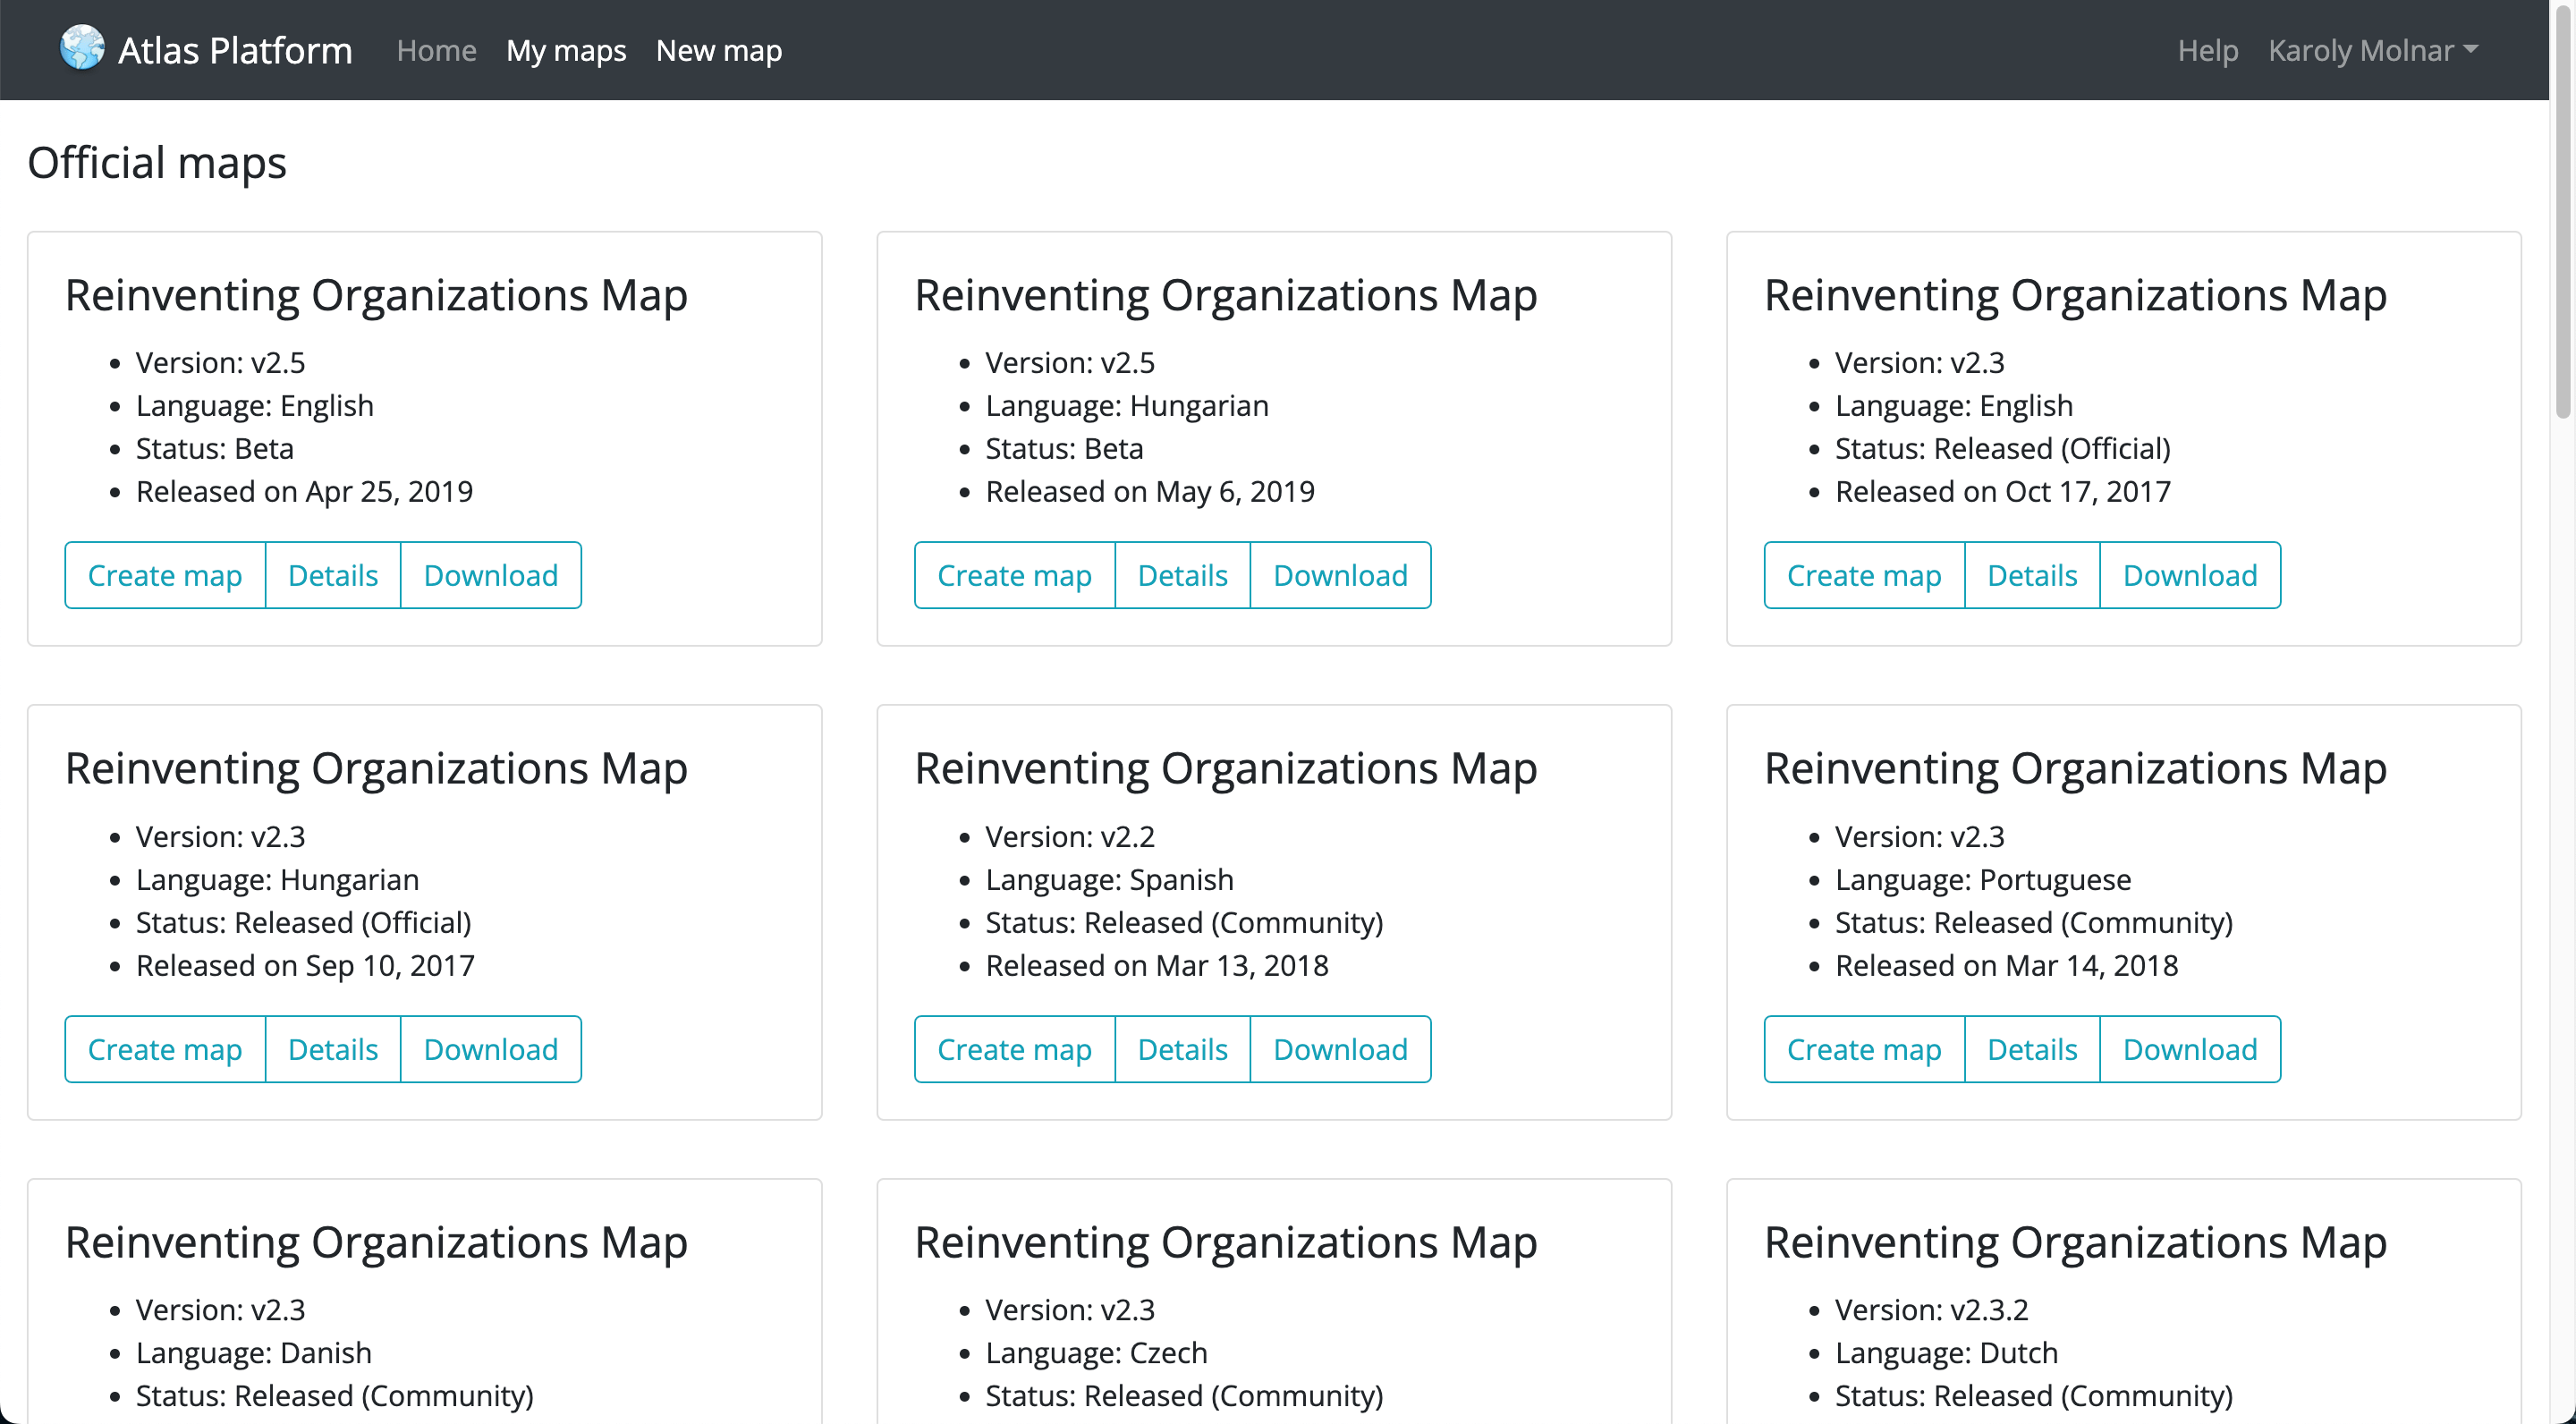
Download or create a map
When you click “Create map” you need to provide the company name and some information.
Data entry
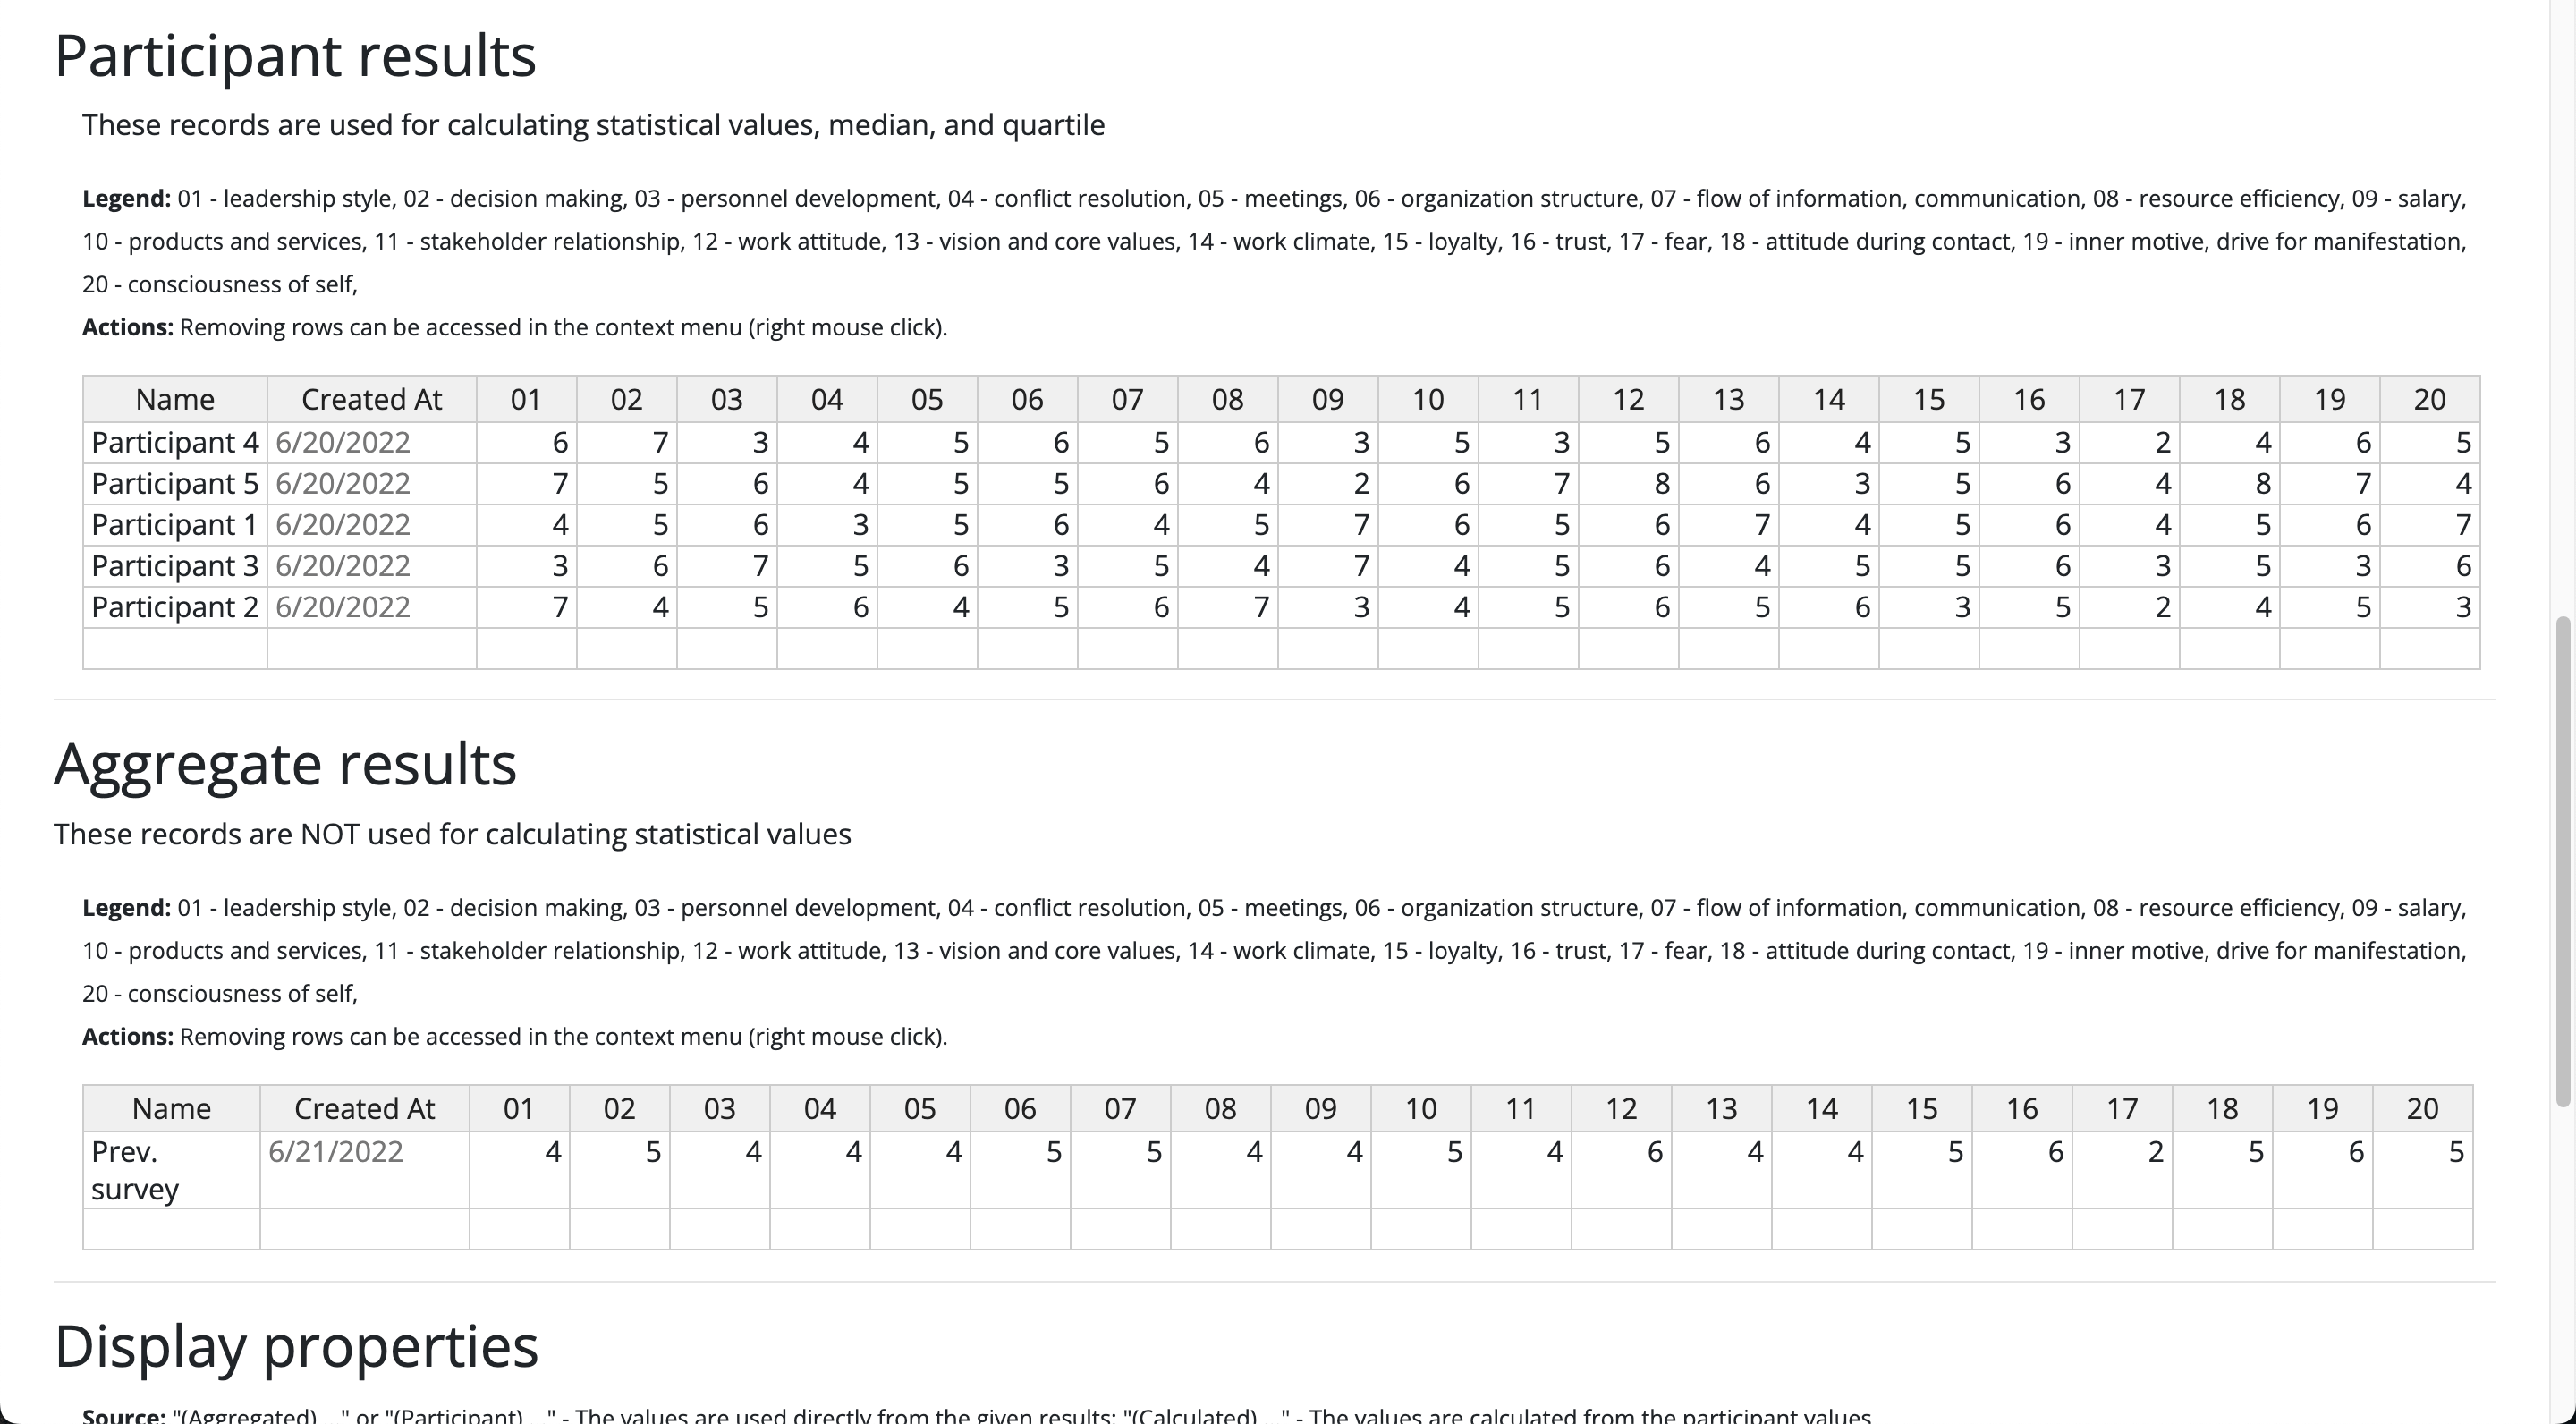
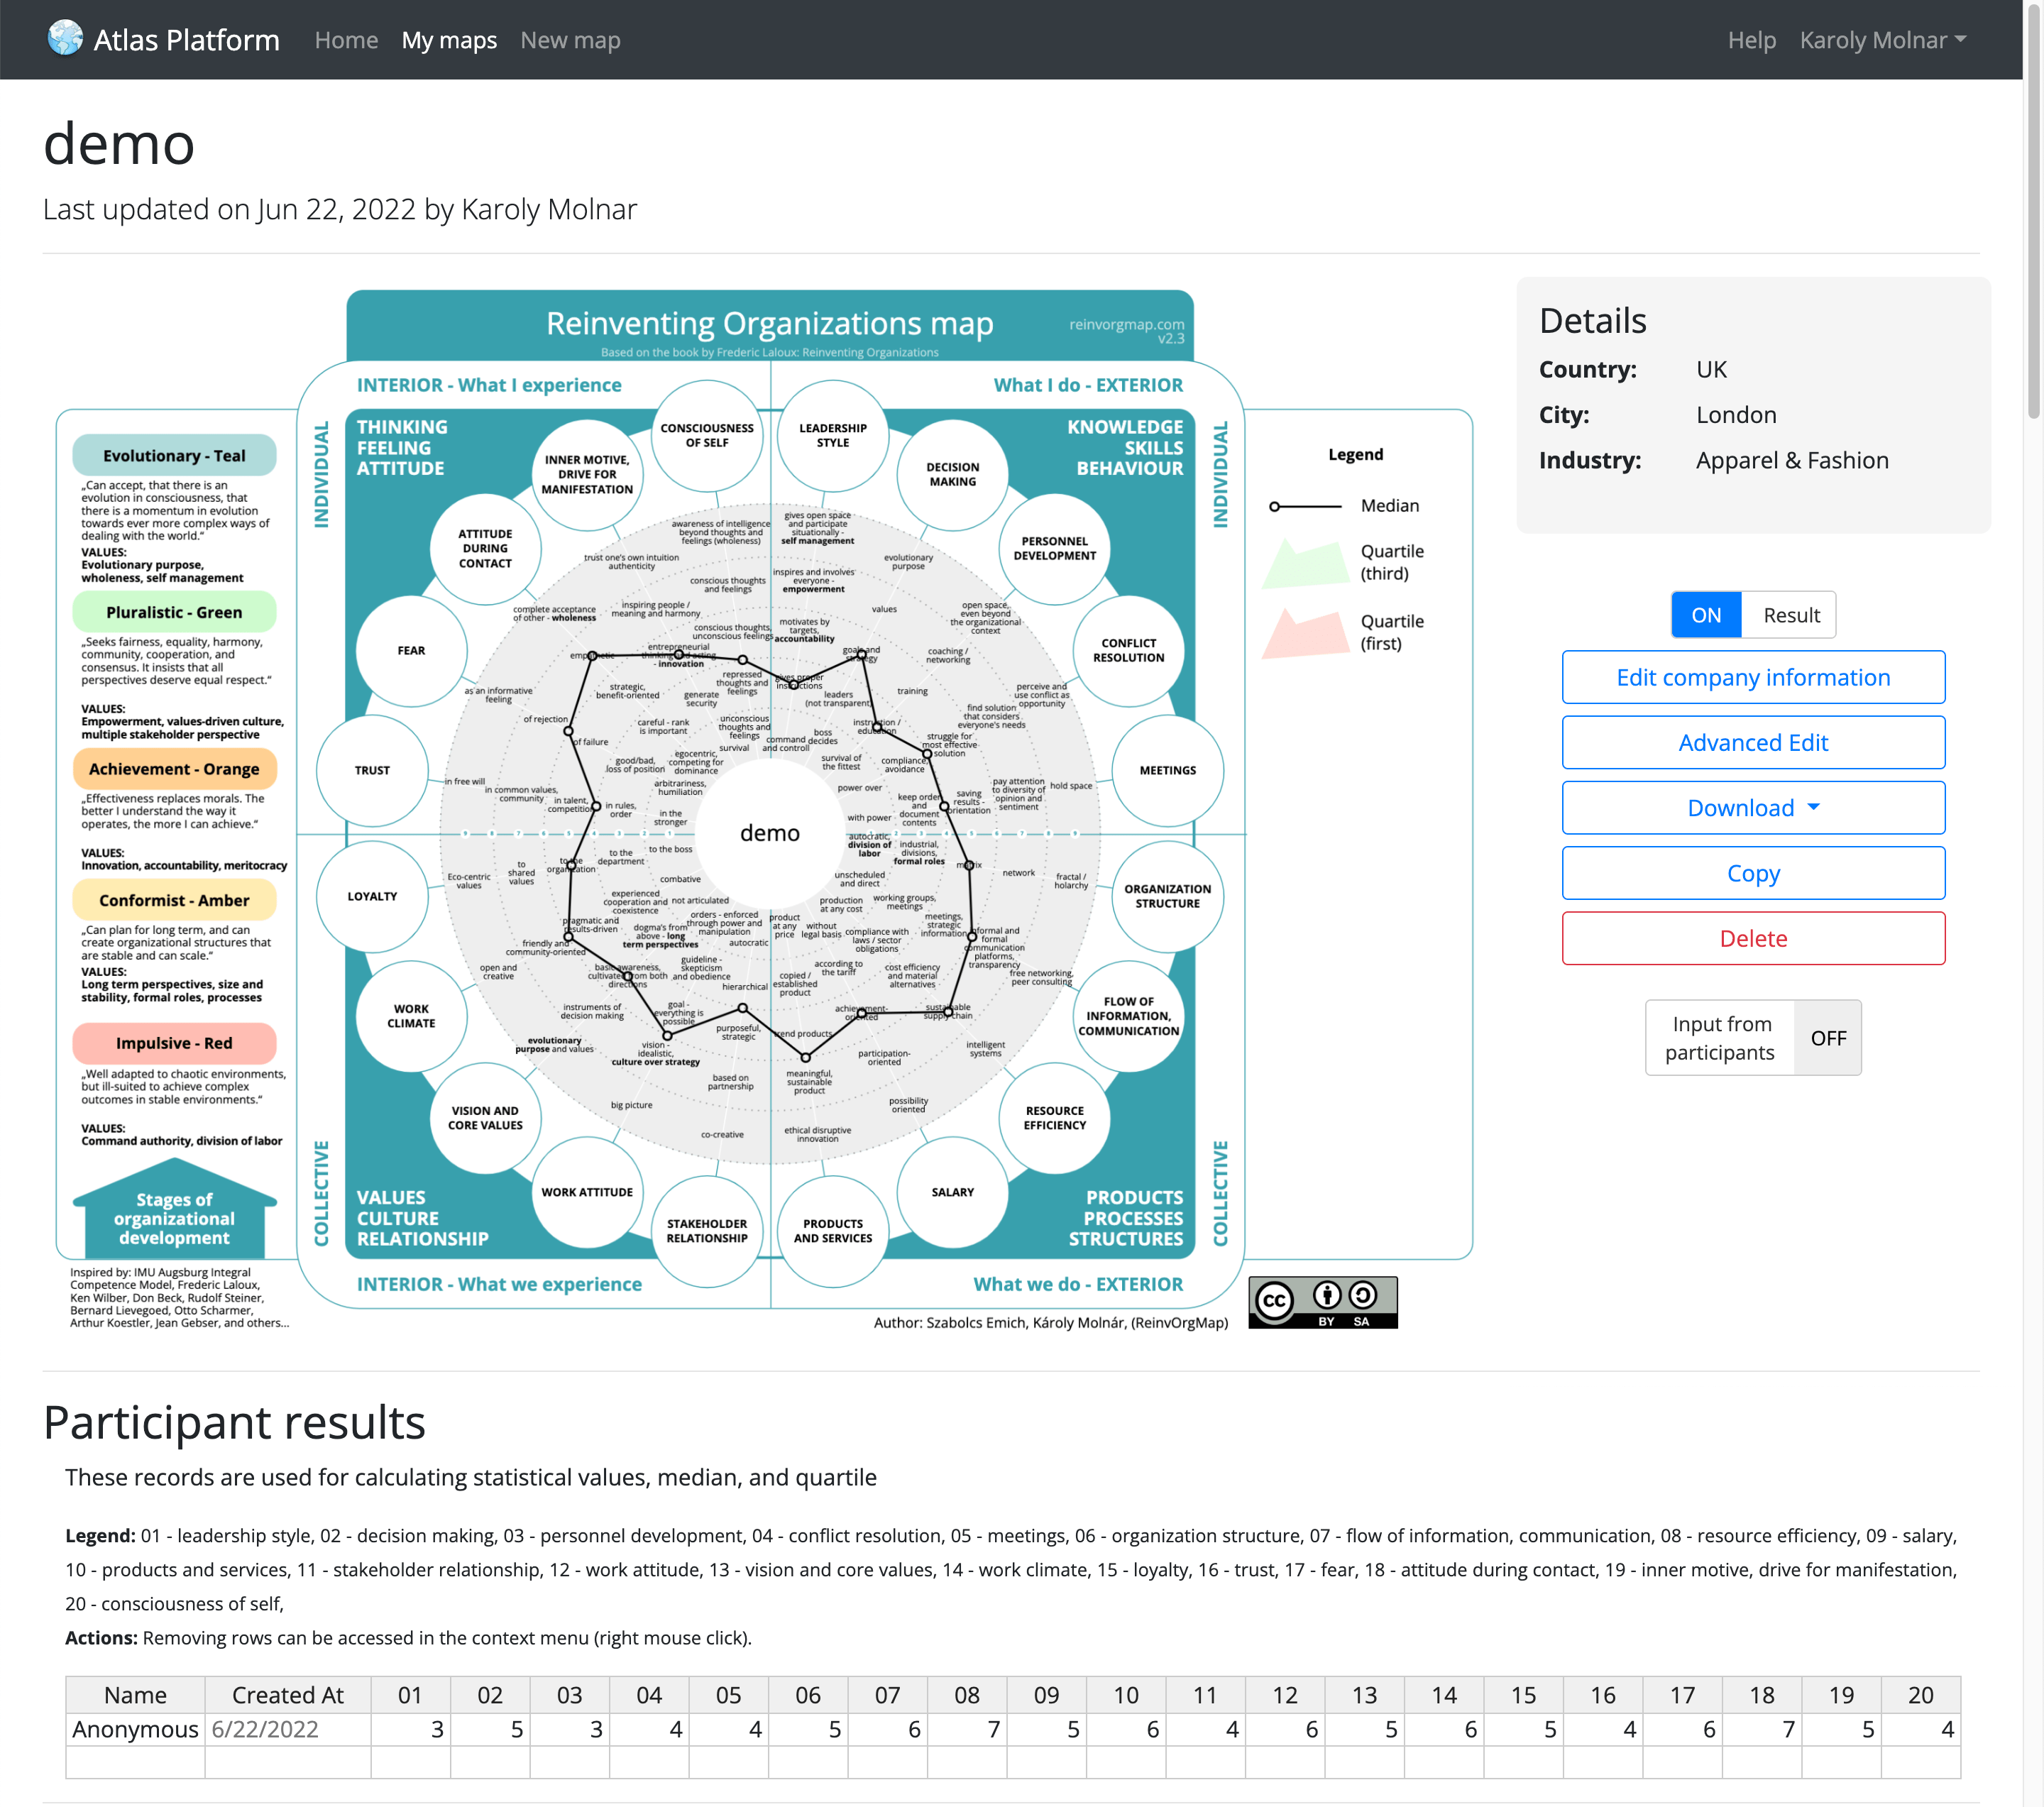
Participant results
If you have information from assessments, you can enter the data into the Participant results table. The system calculates median and quartile from that data, and it can be used for visualizing the results.
Aggregate results
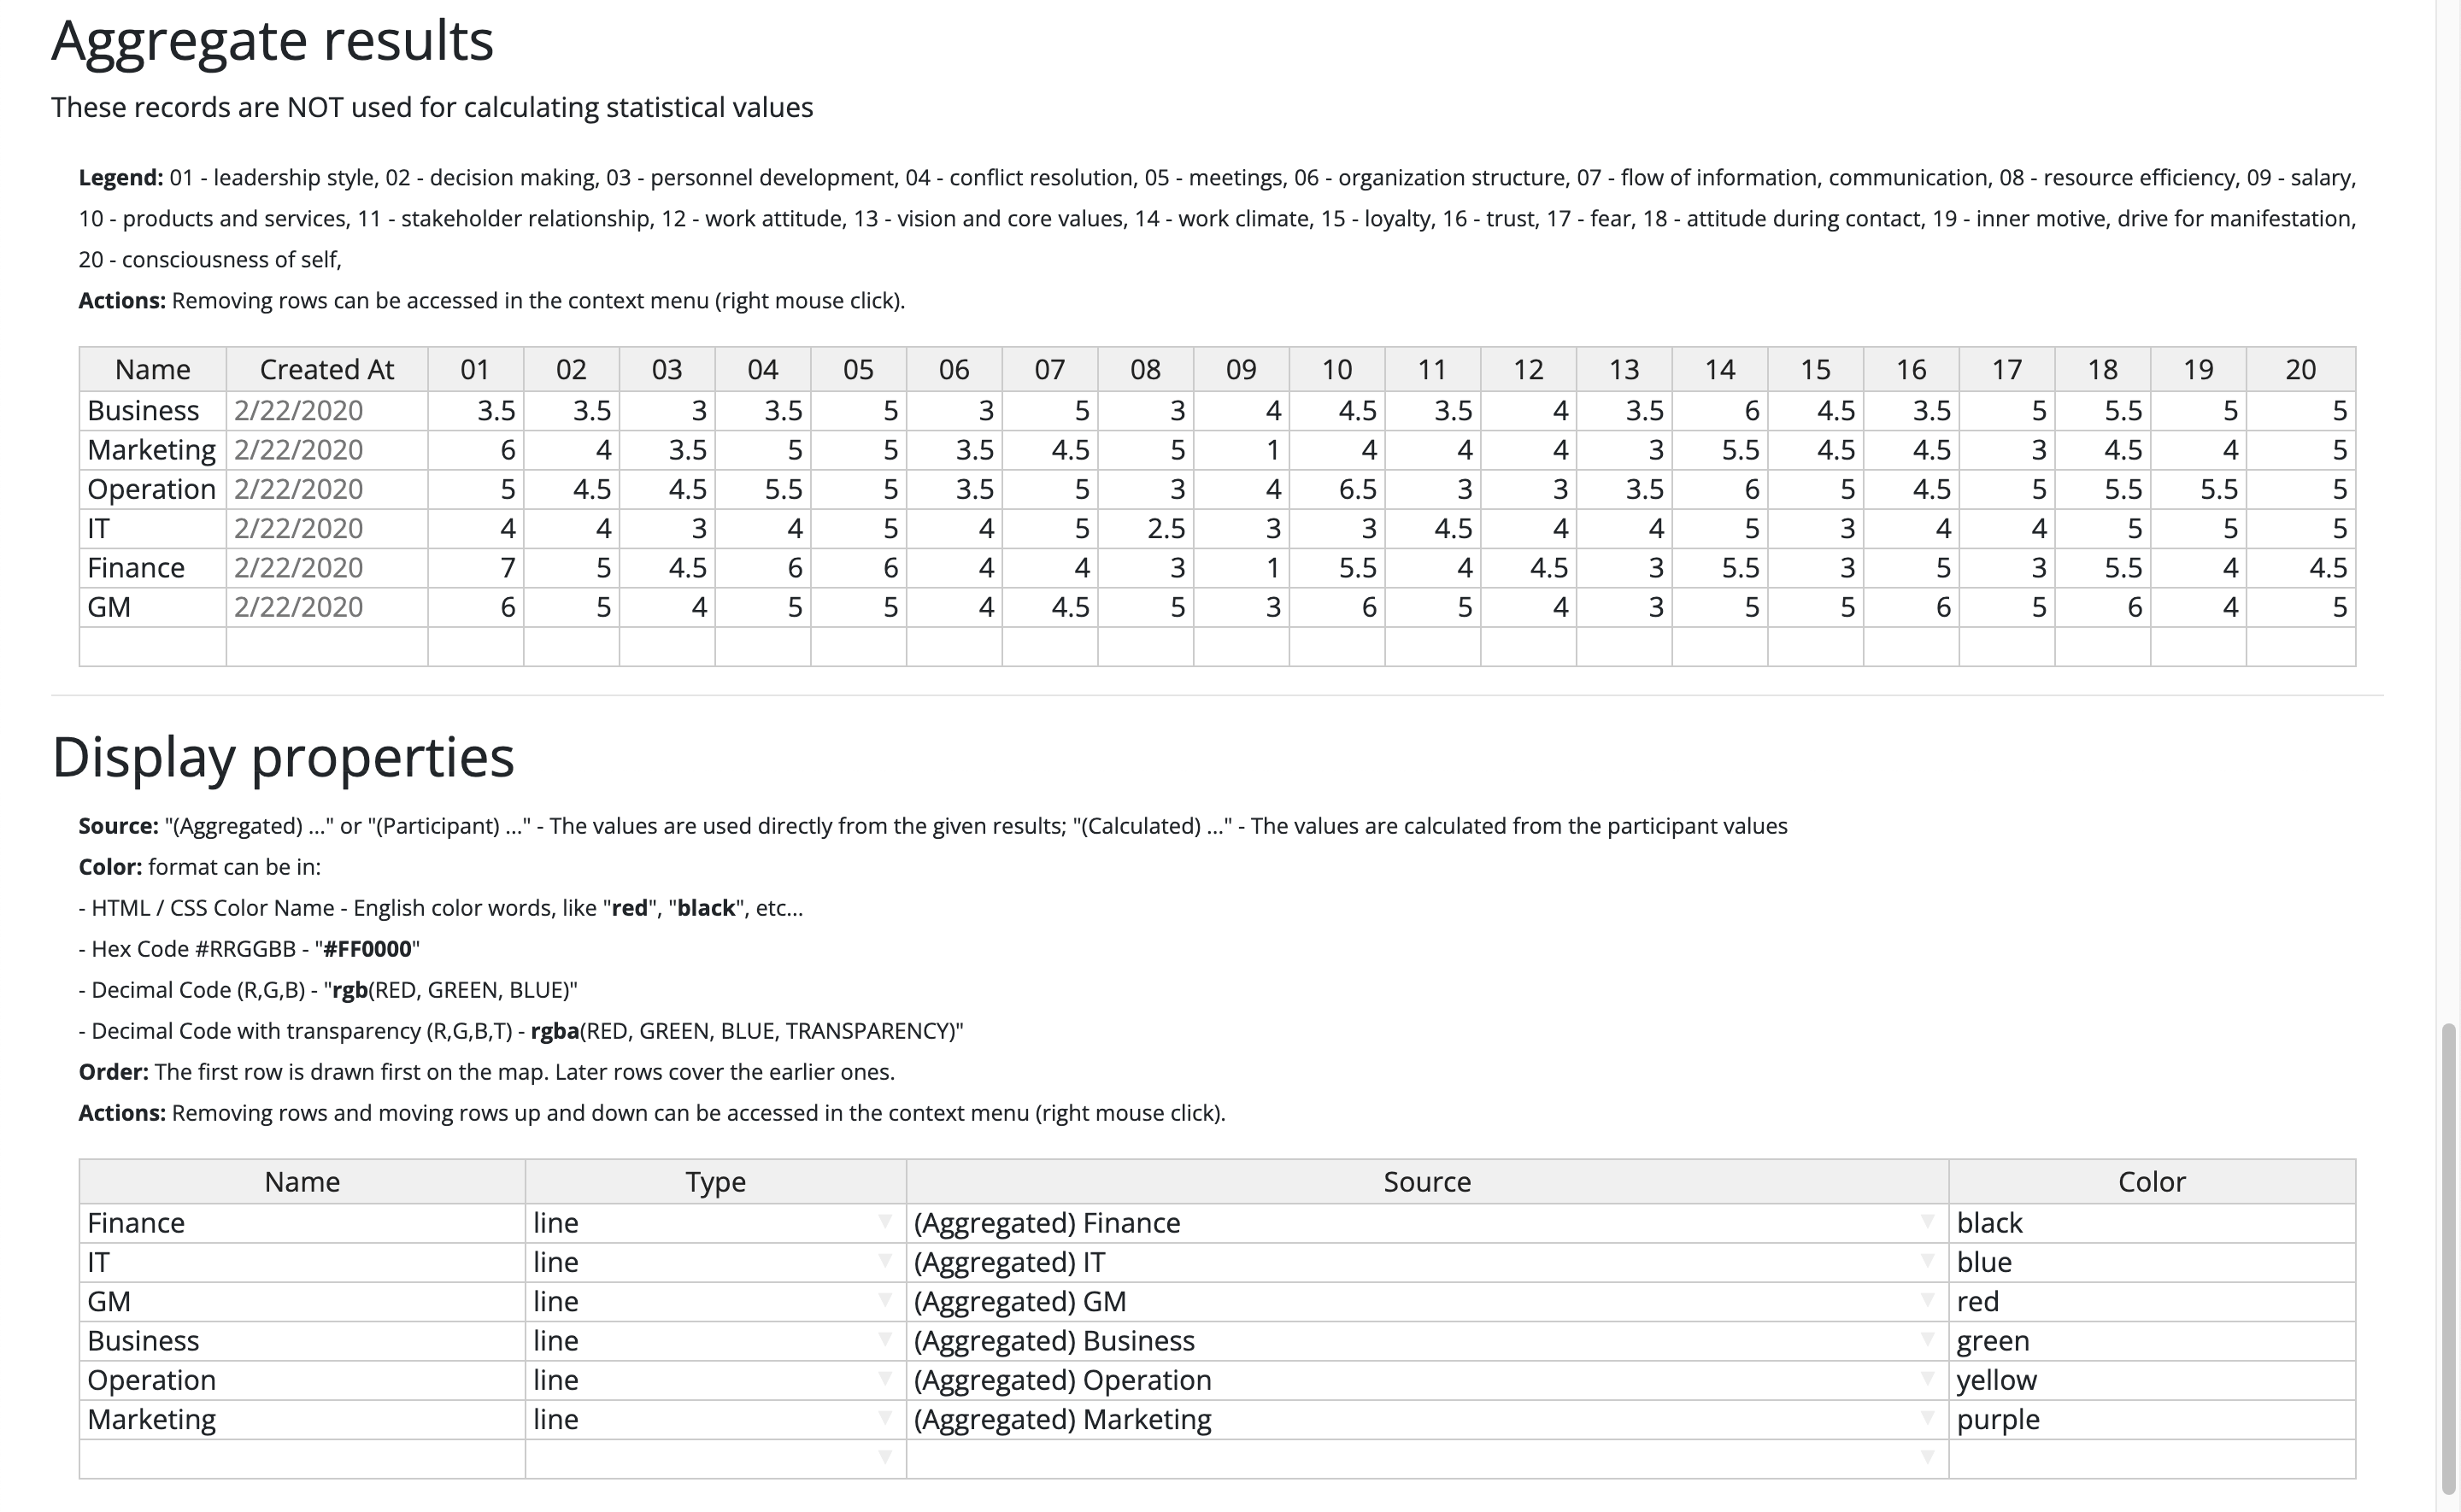
The data entered into the aggregate results table are not used for calculating statistical information, however the records can be used for visualization.
For example: Previous survey, or an another team’s results
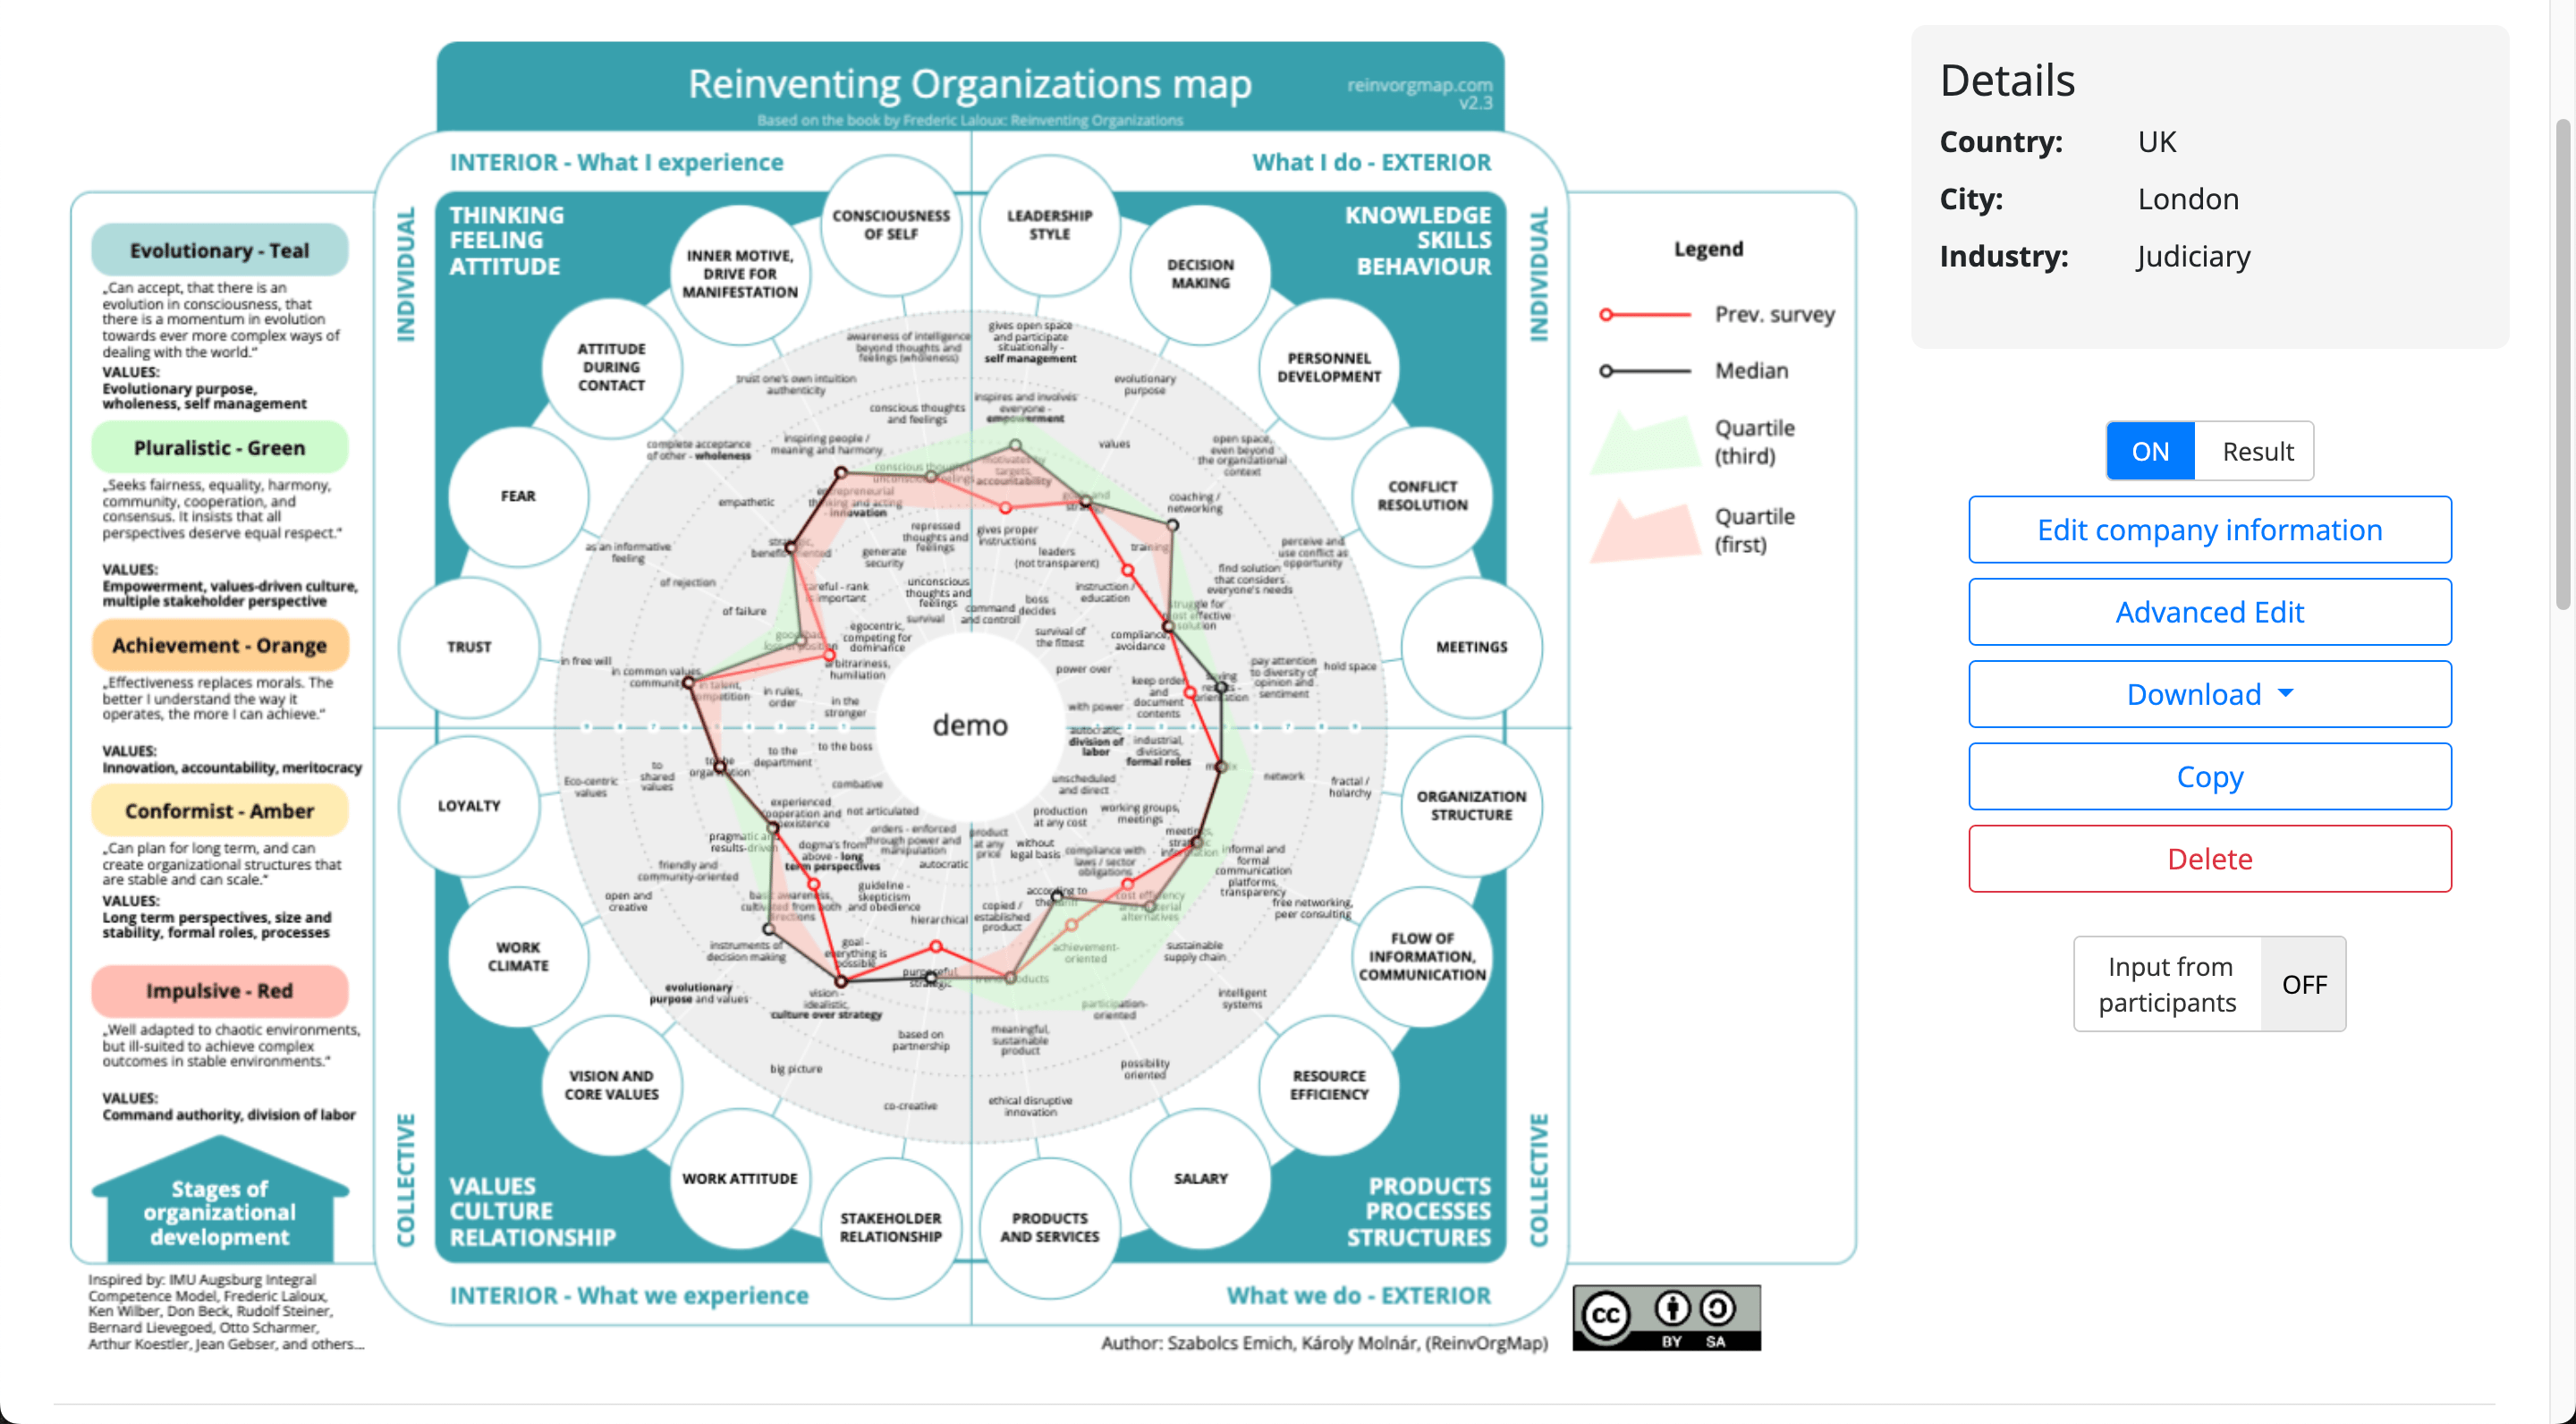
Visualizing results
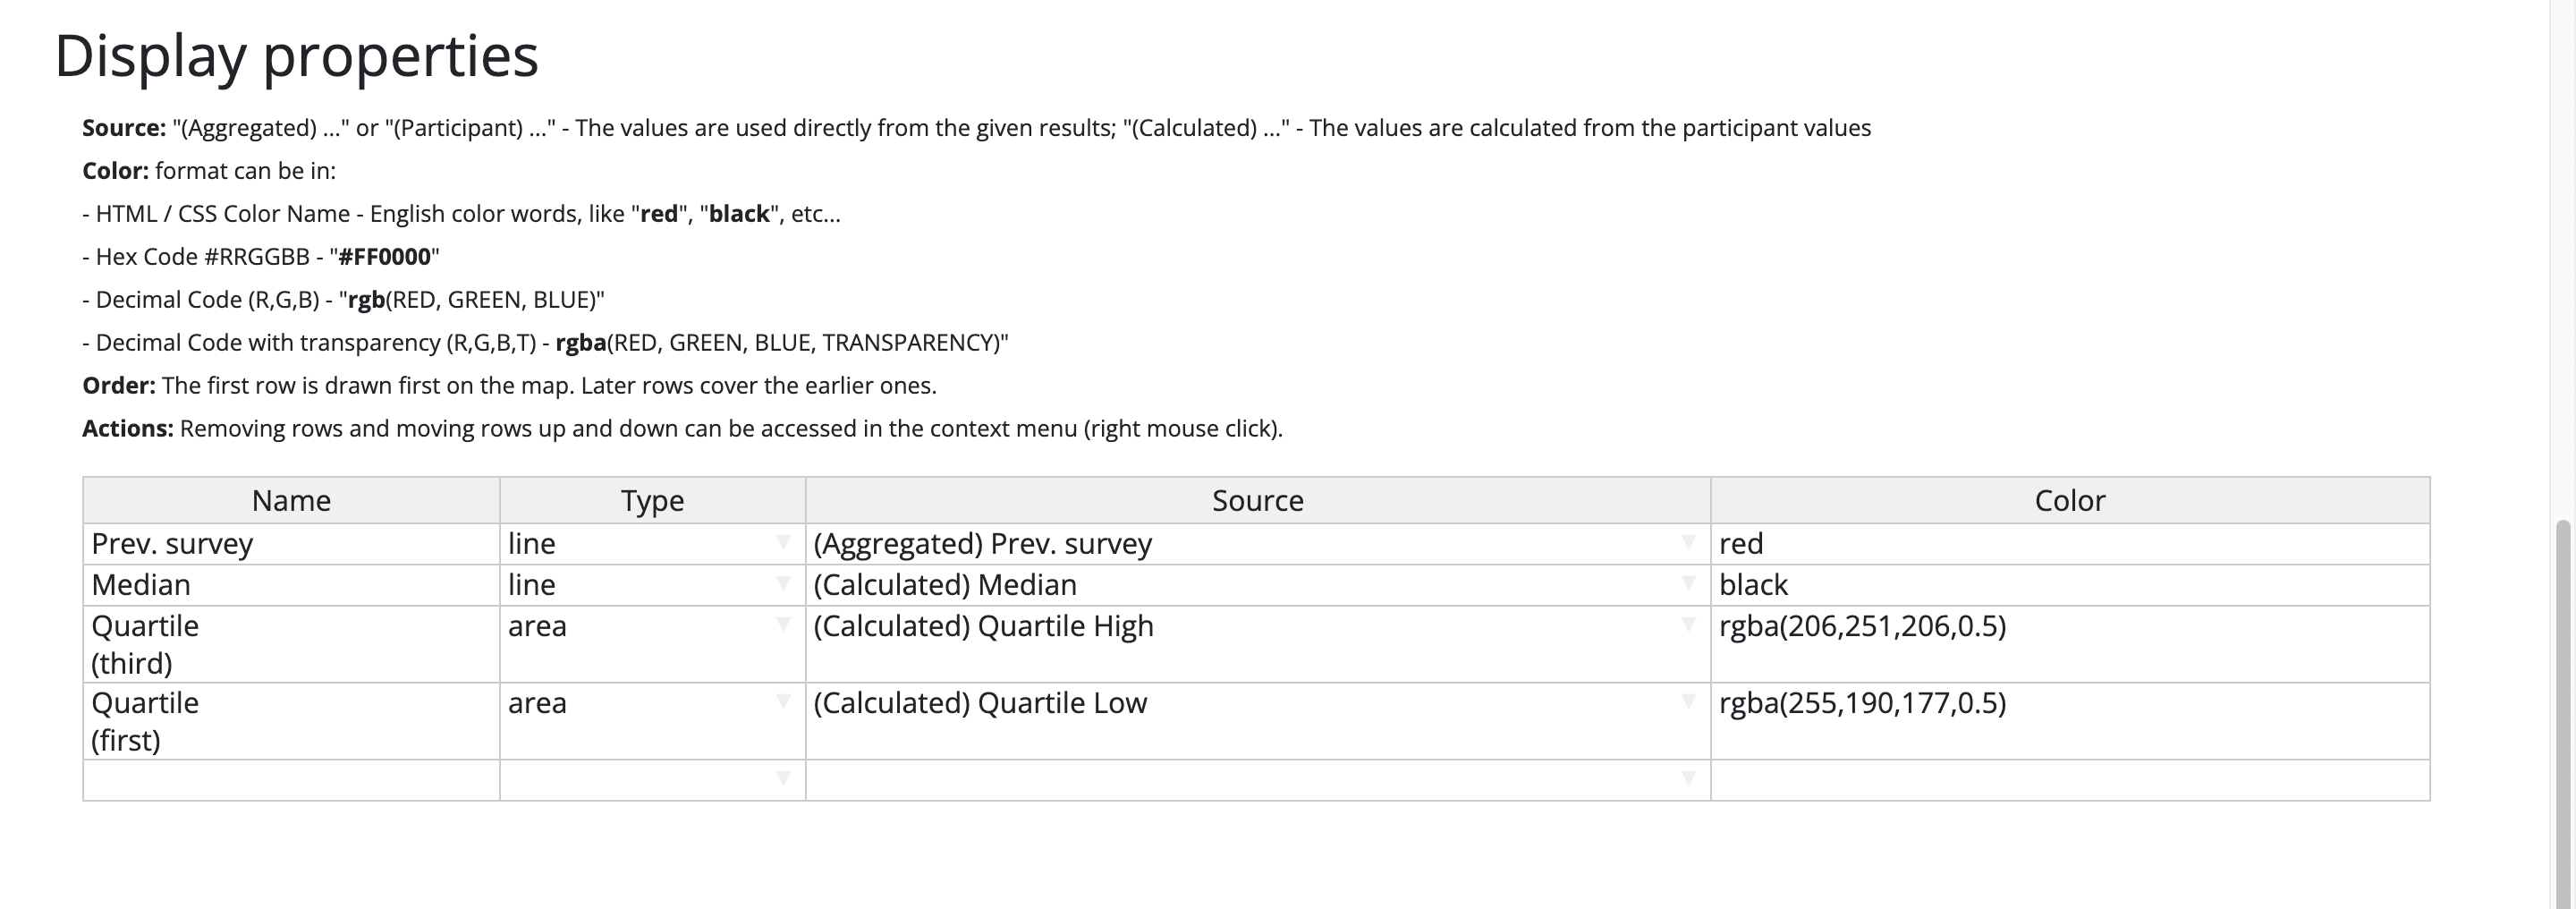
- Type:
- dot – Places a dot on the map
- line – Creates a line on the map, connecting values from one developmental line to the next
- area – One edge is always the median, the other is the one provided in Source
- Source:
- “(Aggregated) …” or “(Participant) …” – The values are used directly from the given results
- “(Calculated) …” – The values are calculated from the participant values
- Color: format can be in:
- English color words (CSS color names) – “red”, “black”, etc…
- Hex Code #RRGGBB – “#FF0000”
- Decimal Code (R,G,B) – “rgb(RED, GREEN, BLUE)”
- Decimal Code with transparency (R,G,B,T) – rgba(RED, GREEN, BLUE, TRANSPARENCY)”
- Order: The first row is drawn first on the map and appears first in the Legend. Later rows cover the earlier ones.
- Actions: Removing rows and moving rows up and down can be accessed in the context menu (right mouse click).
Compare current and previous survey
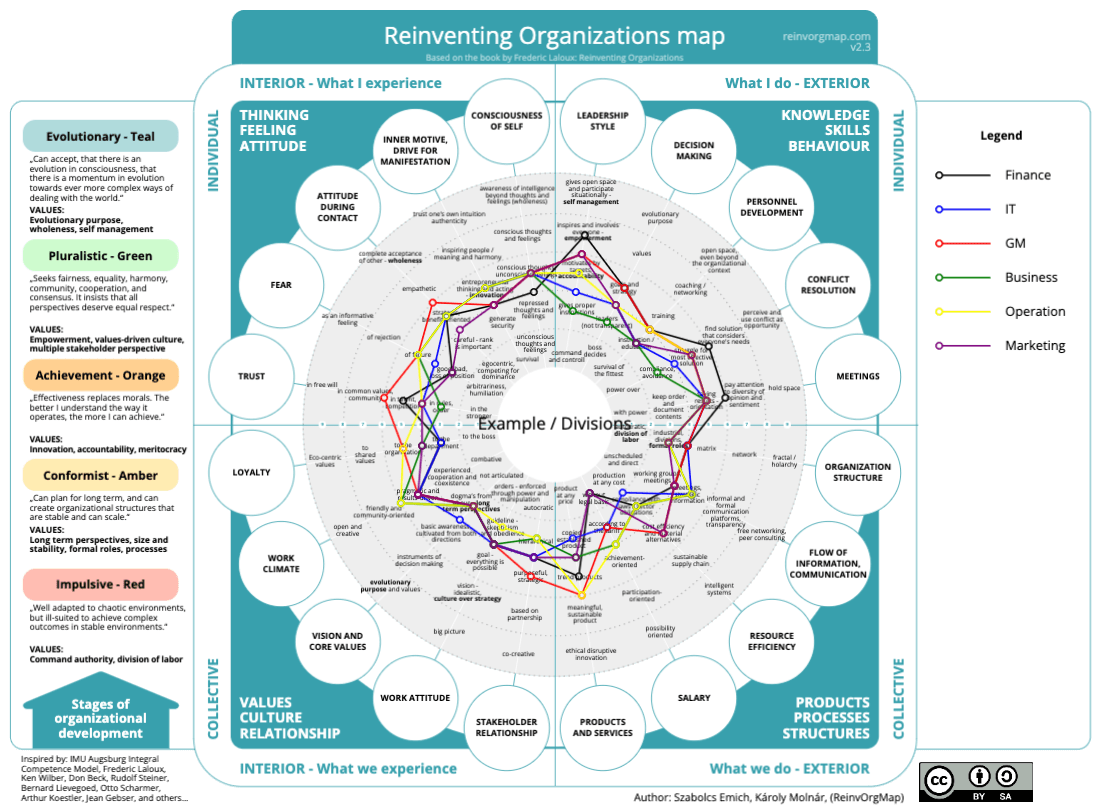
Comparing departments
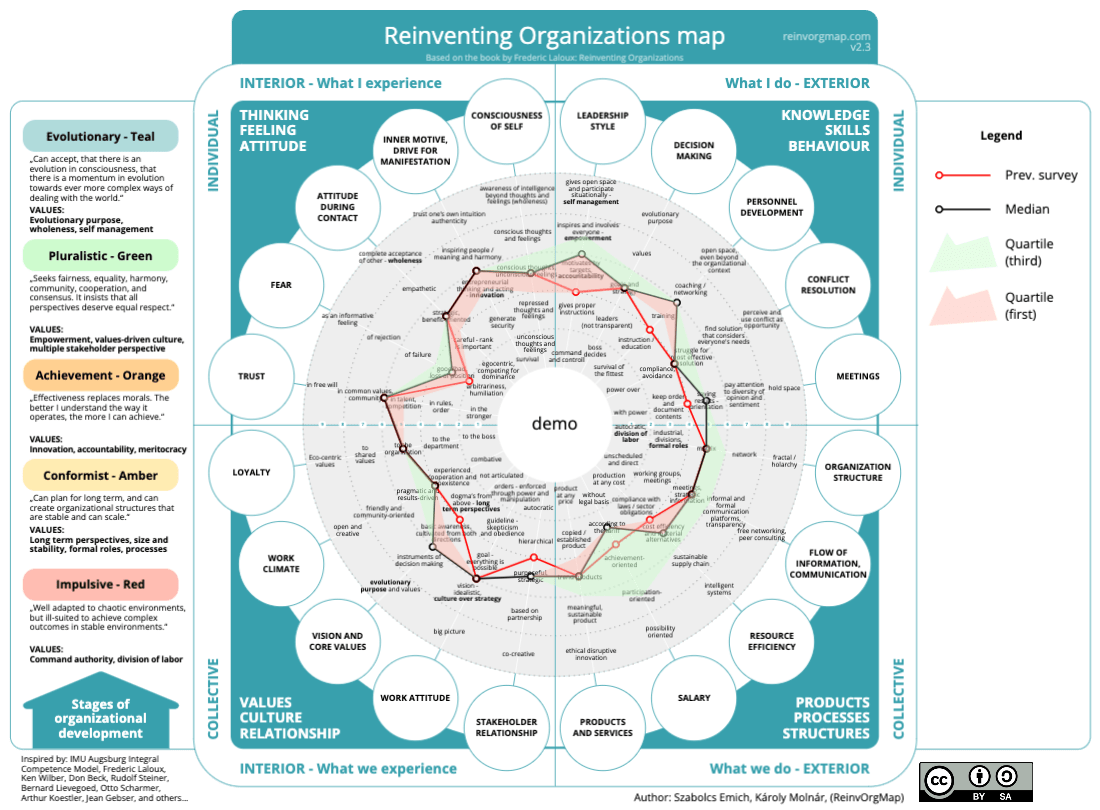
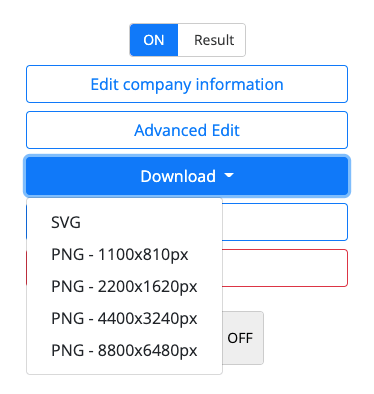
Downloading the map with results as an image
You can download the map in SVG – Scalable Vector Graphics or in PNG – Portable Network Graphics
If you use the SVG you need to have the Open Sans font installed on your computer, because the SVG does not contain it.
Collecting information – survey
You can collect assessments from participants at a workshop or by sending the link to them. Participants will see the Development Line names and can choose from the corresponding consciousness levels. This experience can be highly customized by defining questions and answers, or adding additional questions, etc…
See the steps below for regular usage
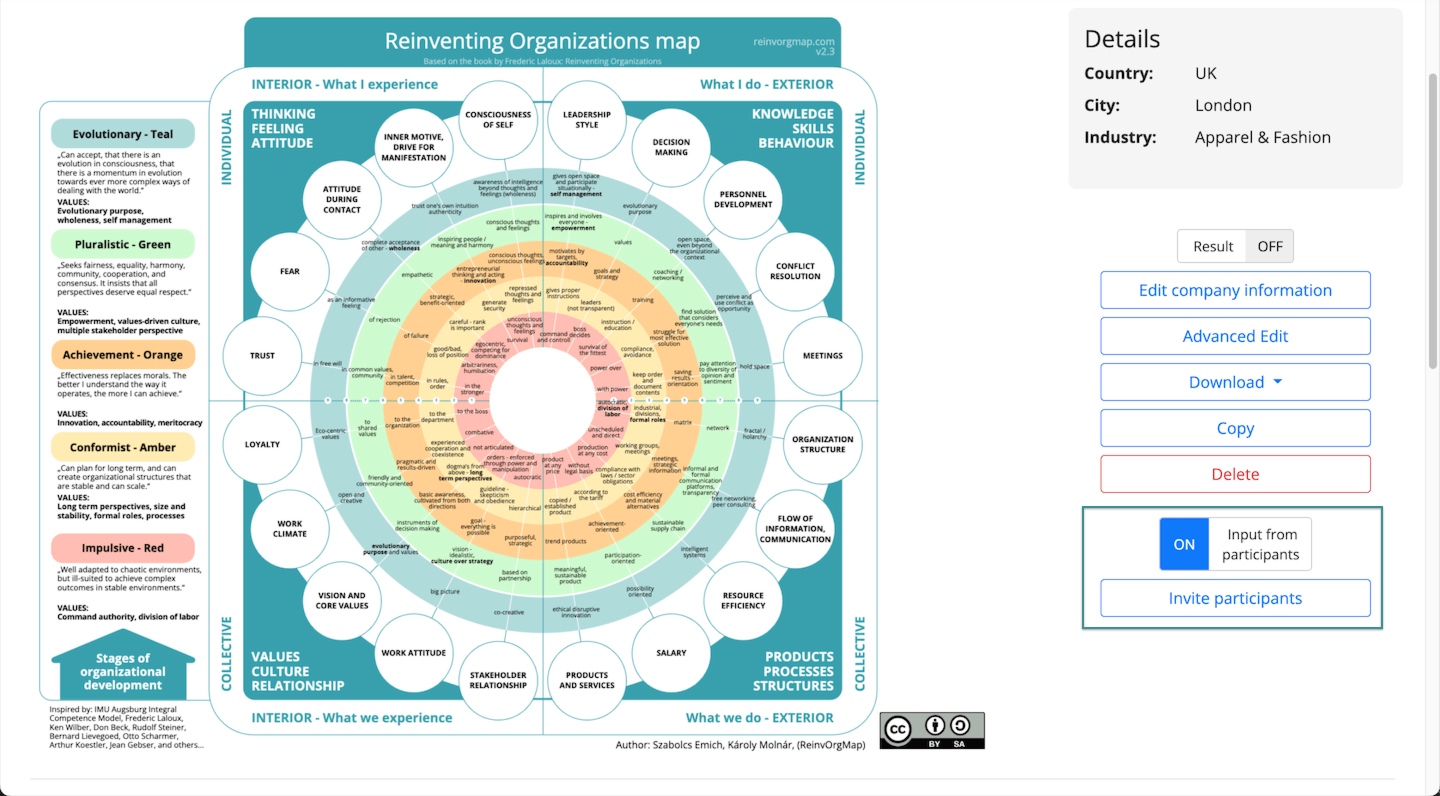
Step 1. Enable participant data entry
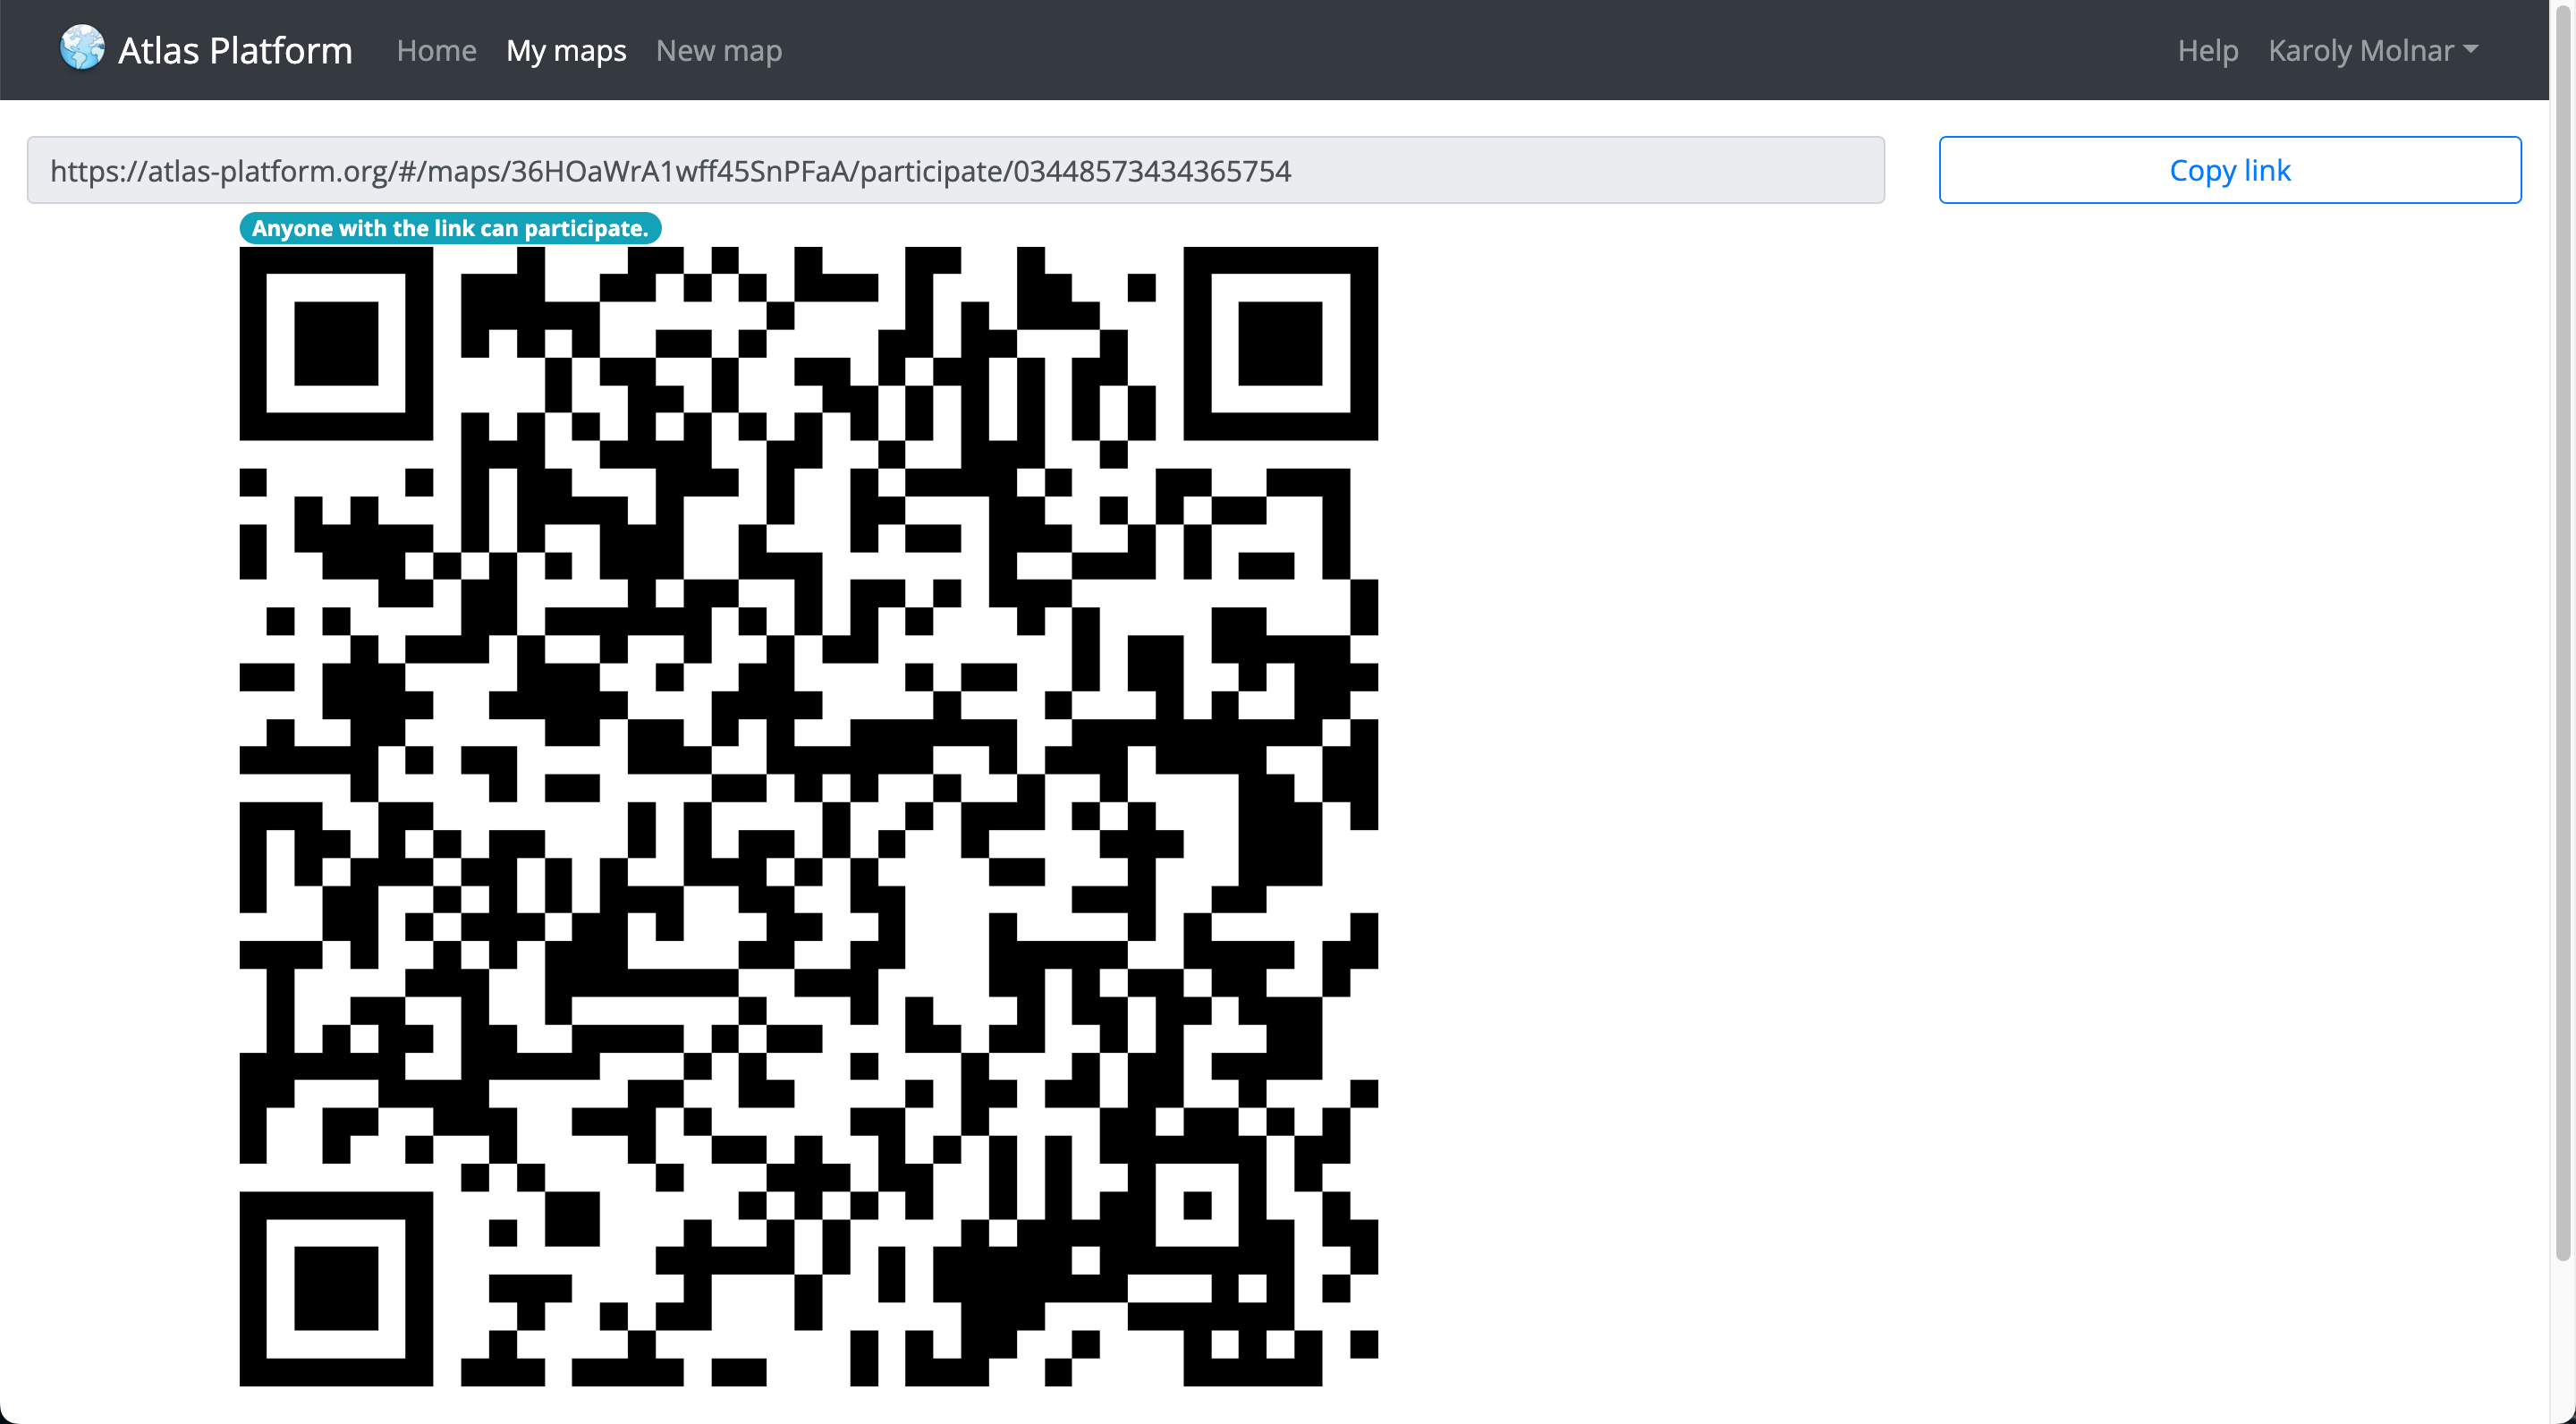
Step 2. Share the link with the participants
You can copy the link and share it with people, or if you are at a workshop, you can just show the QR code and the participants can fill out the survey on their phone.
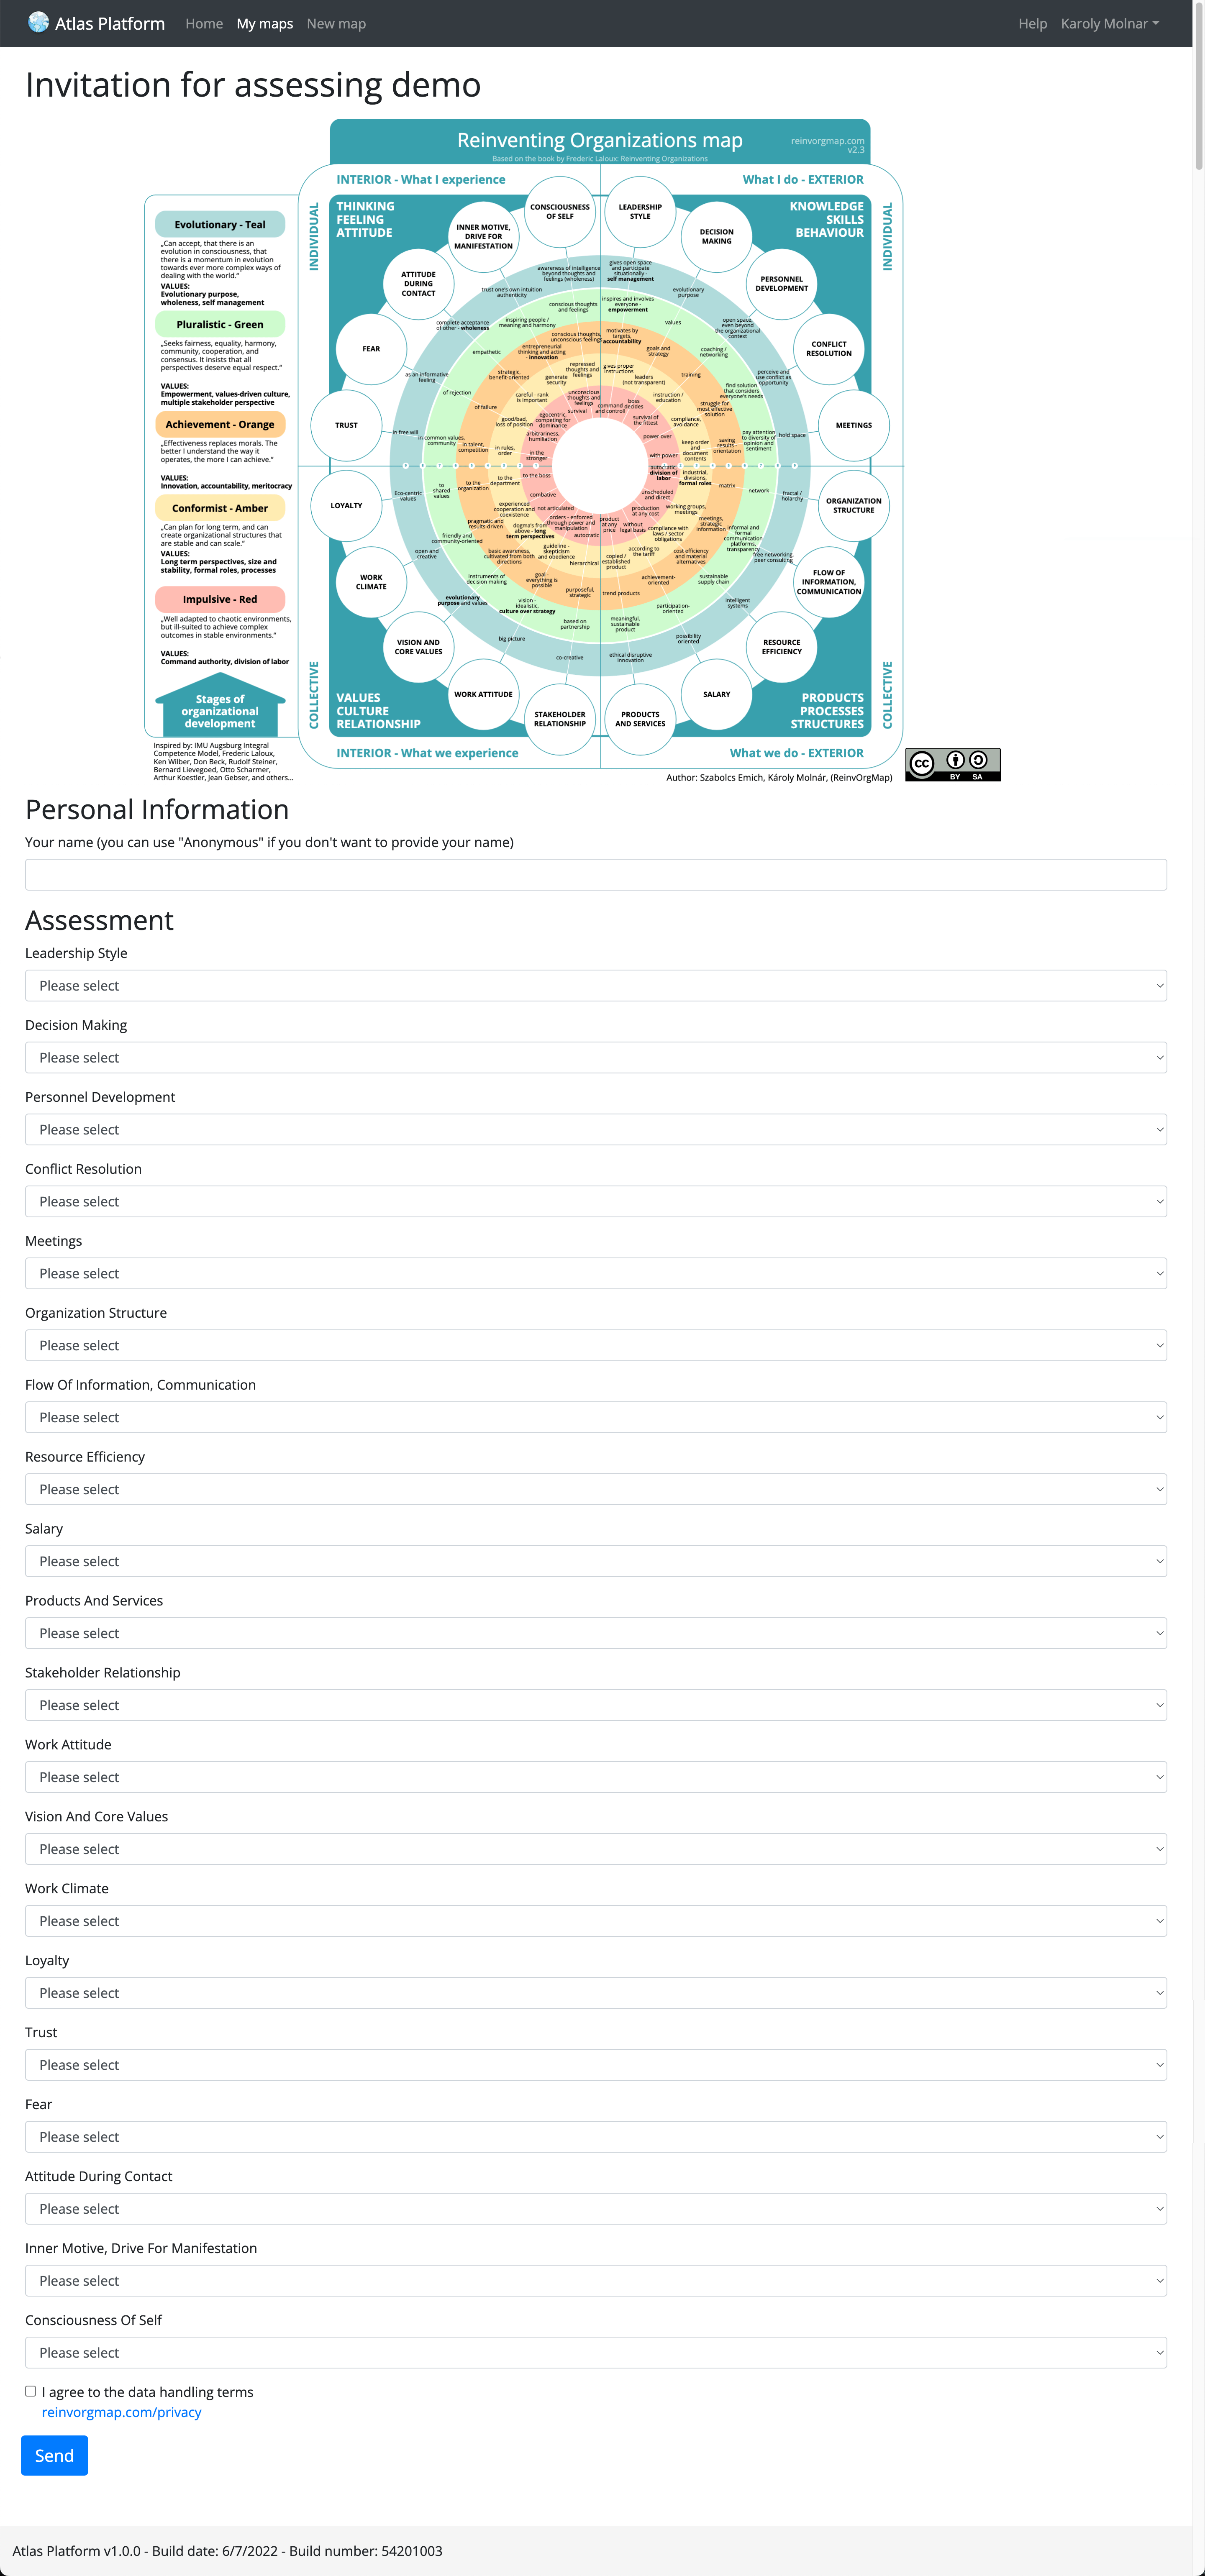
Step 3. Participants fill out the questionnaire
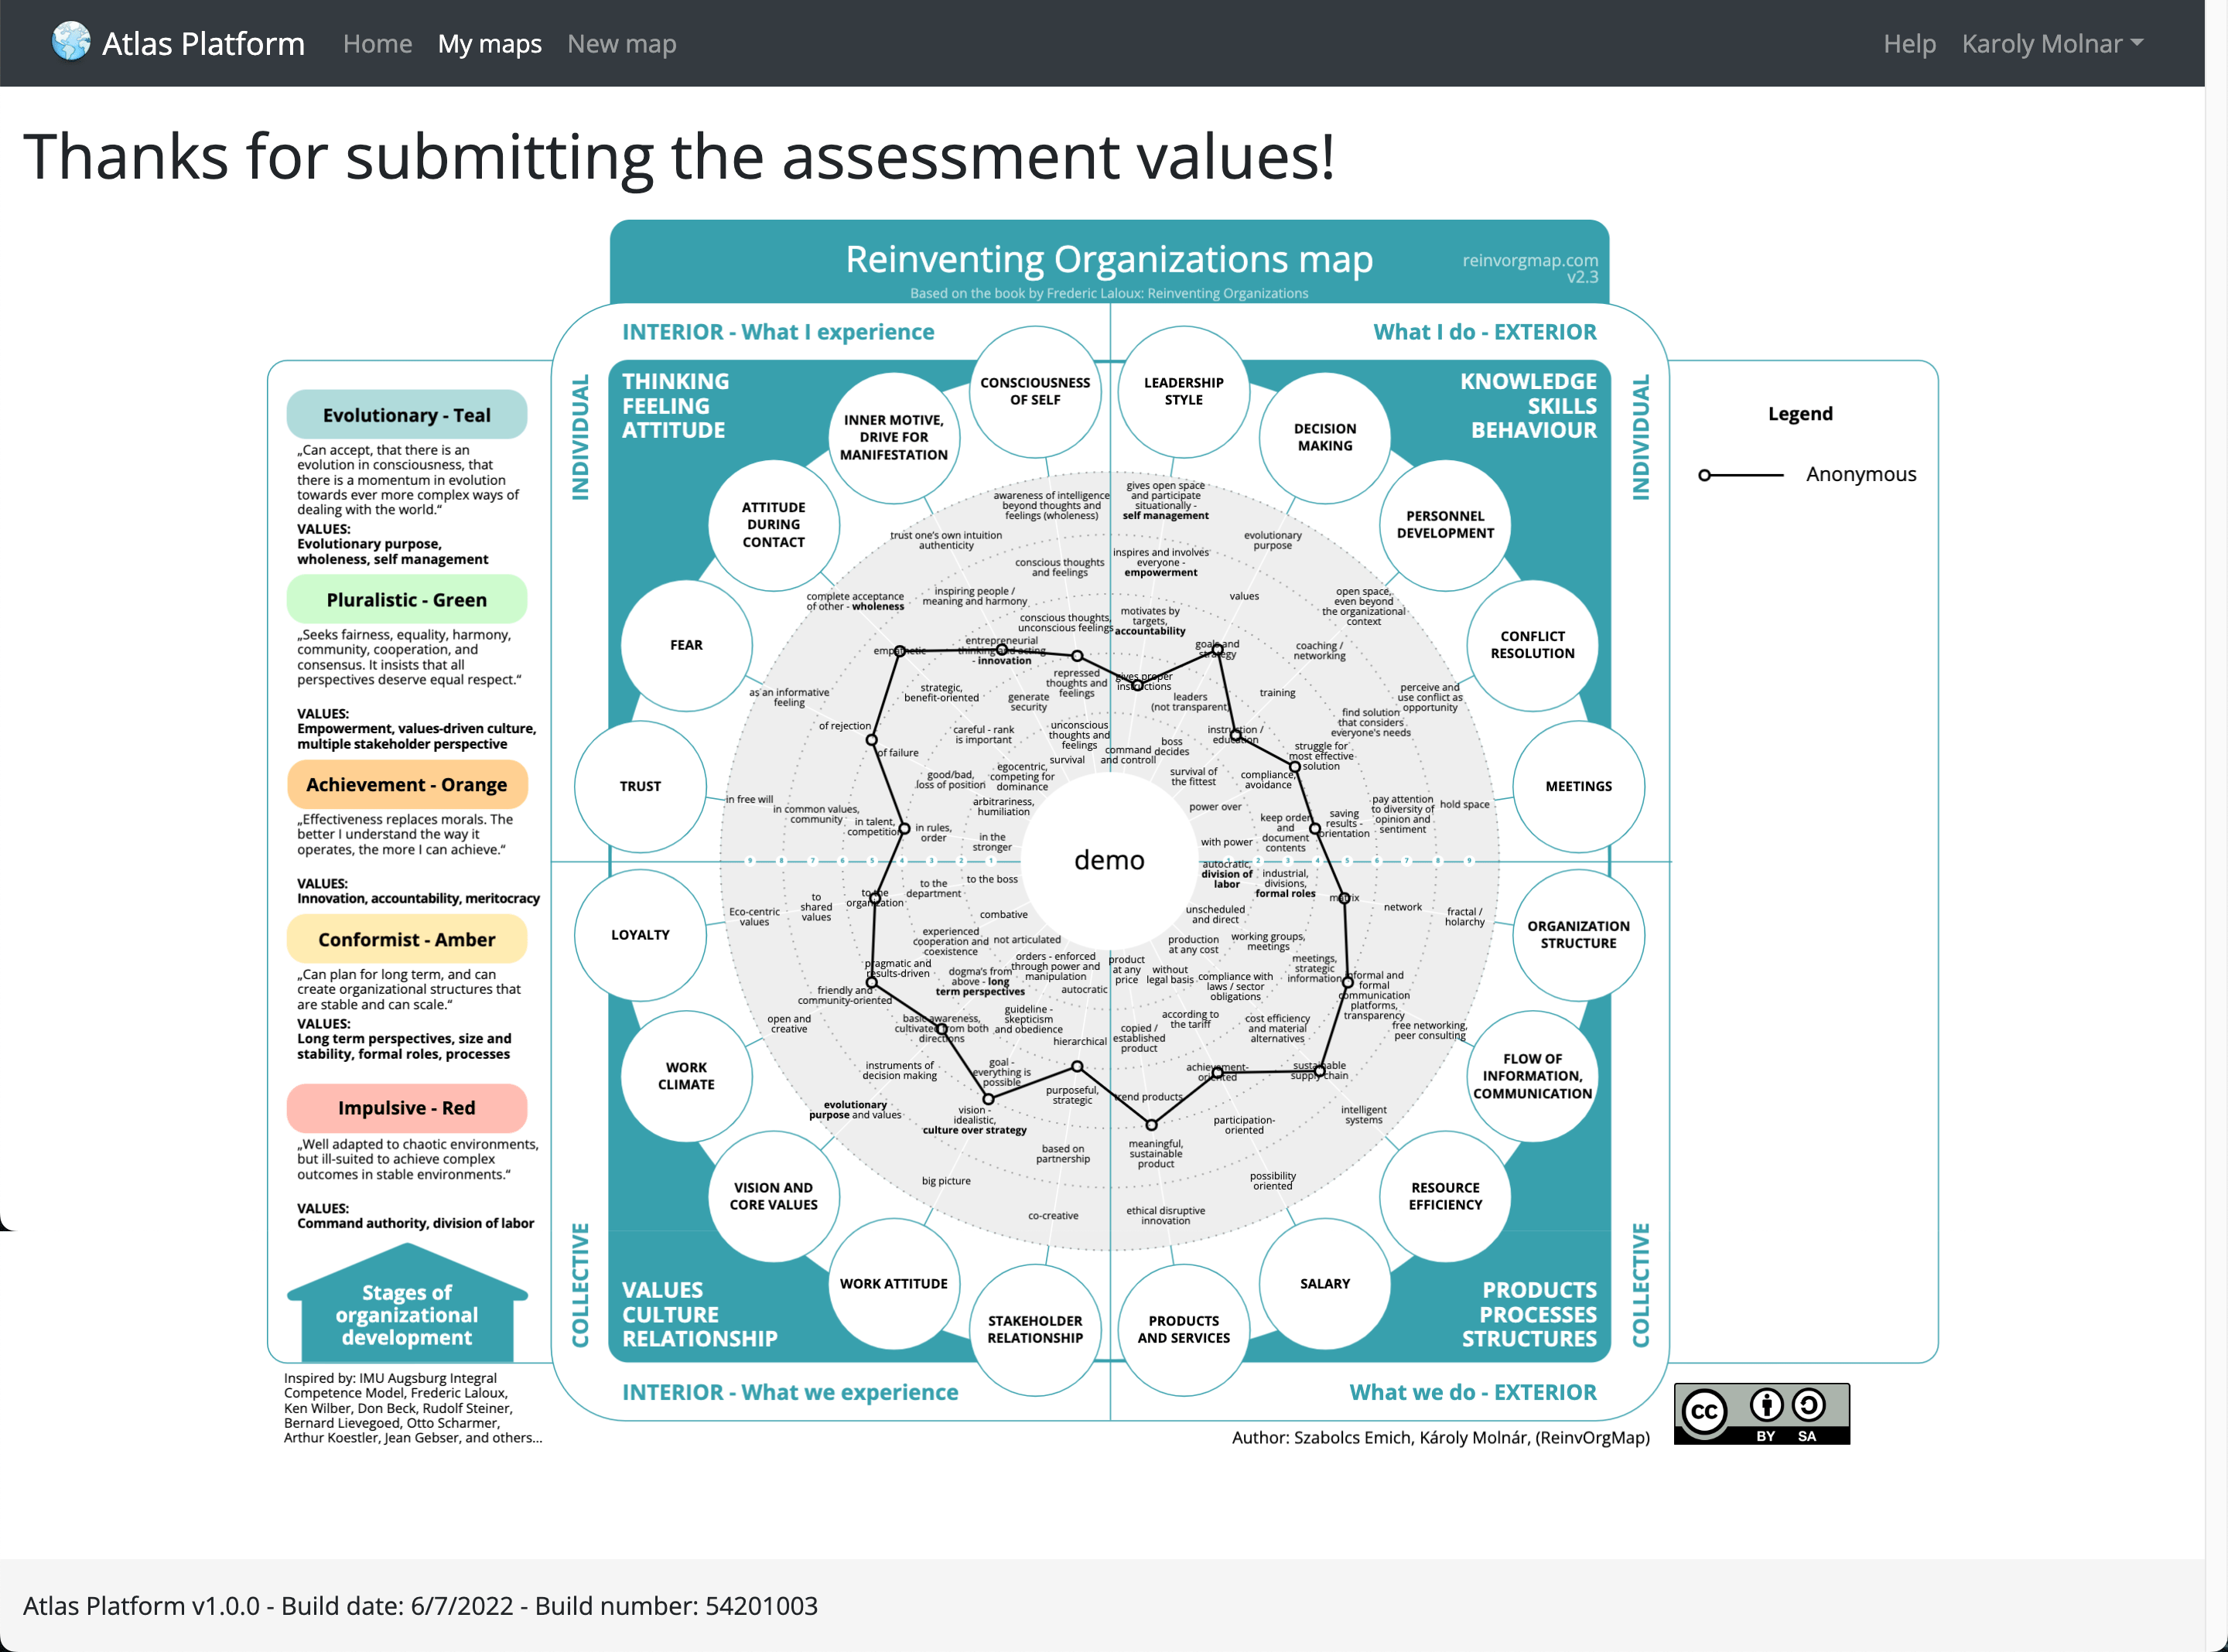
Step 4. Participants see their own result
Step 5. Look at the group result
You can see the results live as participants submit their forms. Optionally, you can disable the entry form, which will disable further submissions.

